Plot the roll distribution
roll-plot.RdPlot density, distribution function, quantile function, and random generation for the discrete distribution described by a roll expression. See below for more details.
droll_plot(roll, ...)

proll_plot(roll, lower.tail = TRUE, ...)

qroll_plot(roll, lower.tail = TRUE, ...)

rroll_plot(n, roll, ...)
Arguments
| roll | A roll expression (e.g., |
|---|---|
| ... | Other arguments passed on to plotting functions
( |
| lower.tail | Whether to calculate |
| n | Number of random deviates to return. |
Value
For droll_plot(), proll_plot(), and qroll_plot() a bar plot.
For rroll_plot() a histogram.
Details
Given a roll expression (i.e., an arithmetic expression involving dice),
r() calculates the complete distribution of the outcomes. This is possible
because the distribution is discrete and has a finite number of outcomes.
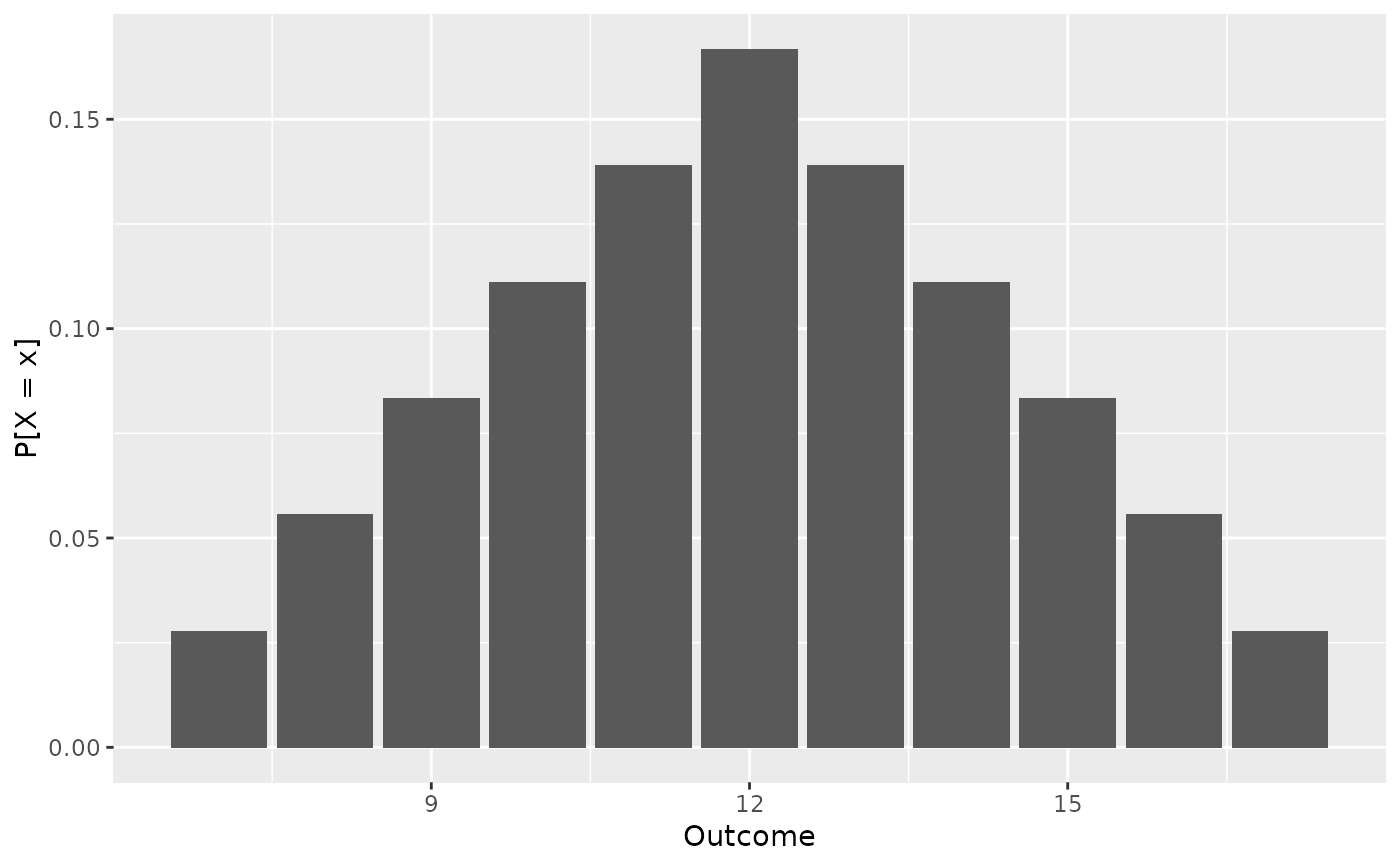
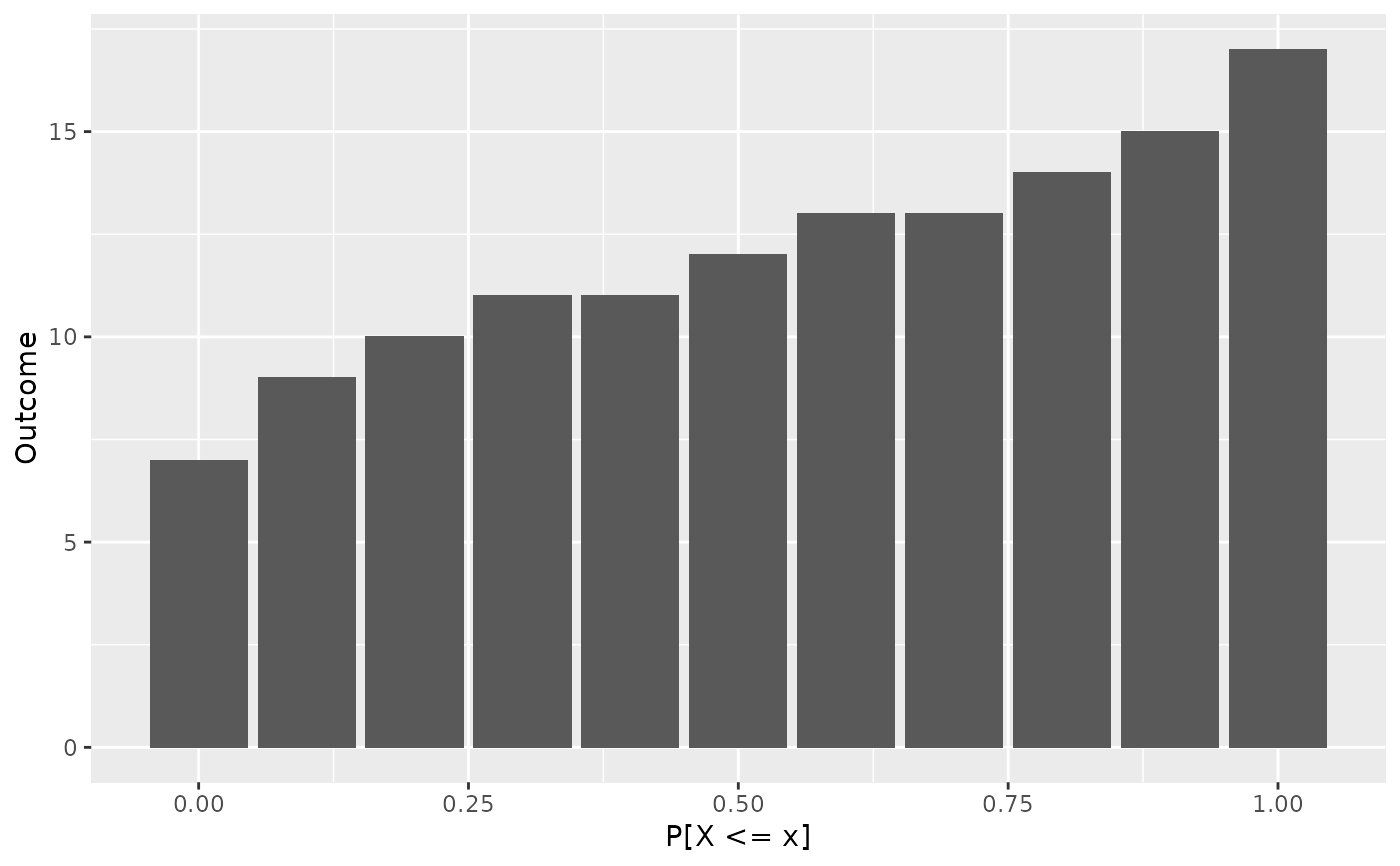
From this distribution, droll_plot() plots the density, proll_plot()
plots the distribution function, qroll_plot() plots the quantile function,
and rroll_plot() plots random deviates.
For more information, see the generating functions: roll.
See also
Examples
# Distribution function of 2d6 + 5 proll_plot(2 * d6 + 5)# Quantile function of 2d6 + 5 qroll_plot(2 * d6 + 5)# Roll 2d6 + 5 rroll_plot(1000, 2 * d6 + 5)